Hey, I'm Kevin Folkes
Welcome to my portfolio! Here, I showcase data analytics projects that solve real-world problems through innovative analysis and visualization. Explore my work to see how I turn raw data into actionable insights.
- All
- SQL
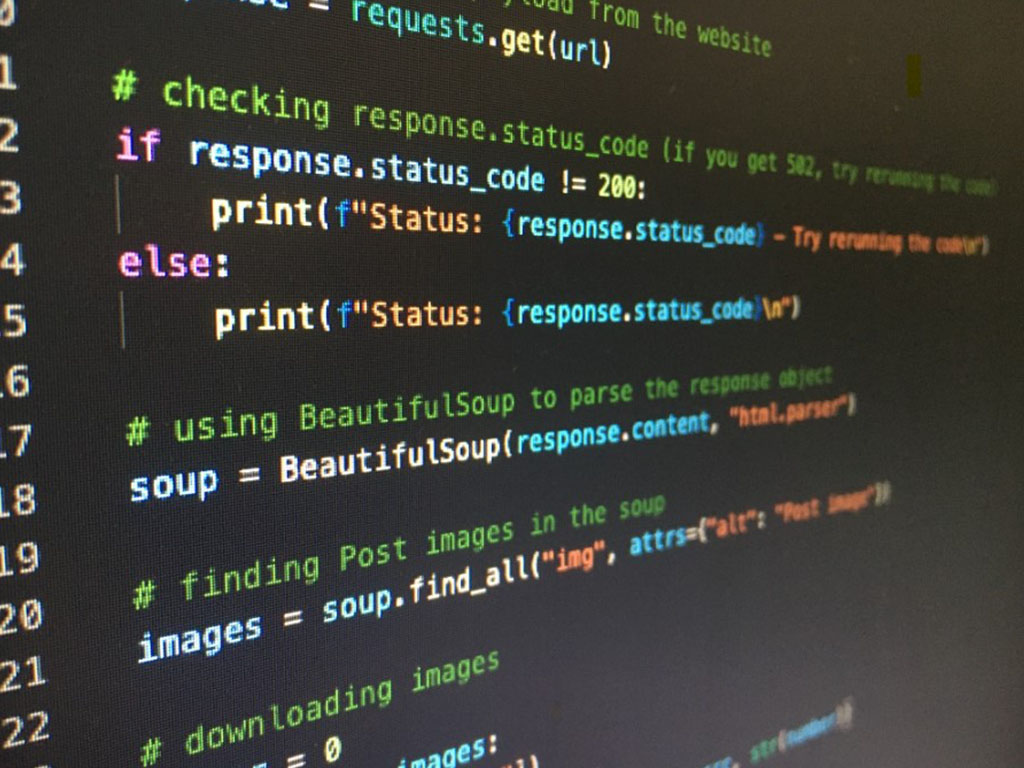
- Python
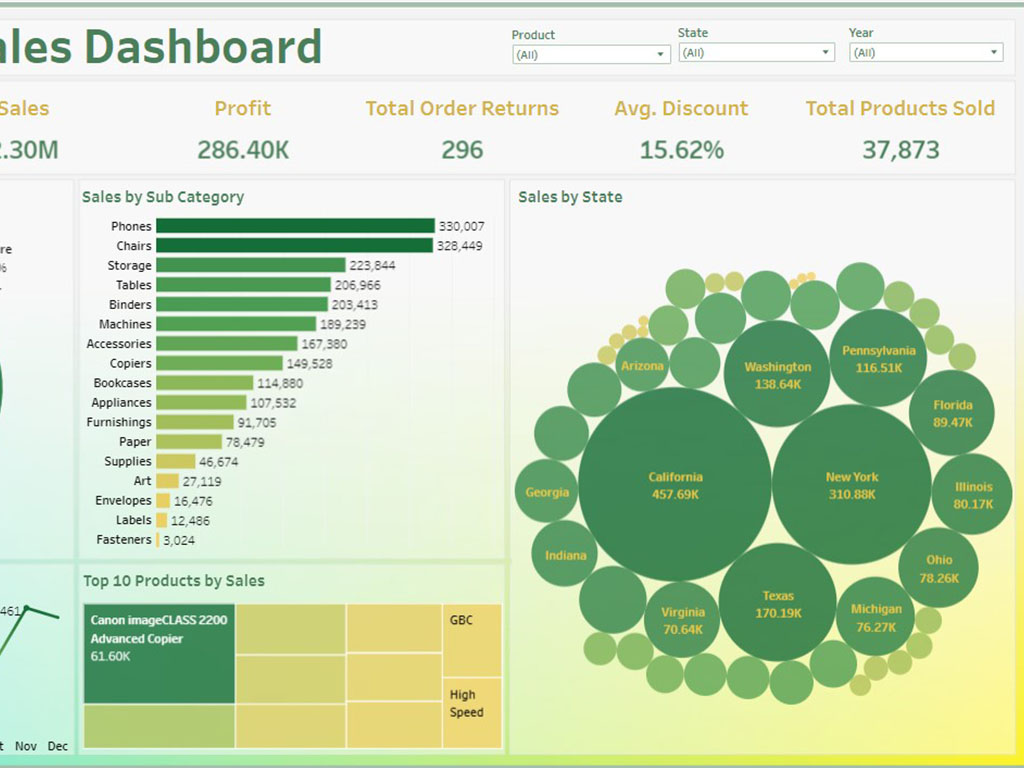
- Tableau
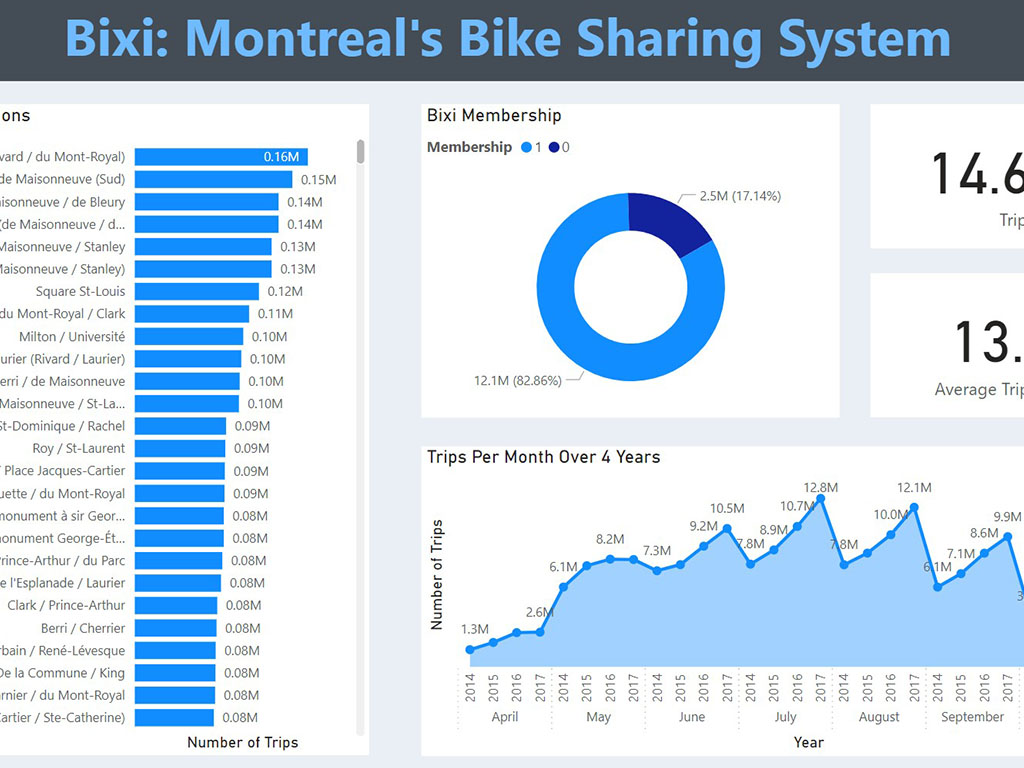
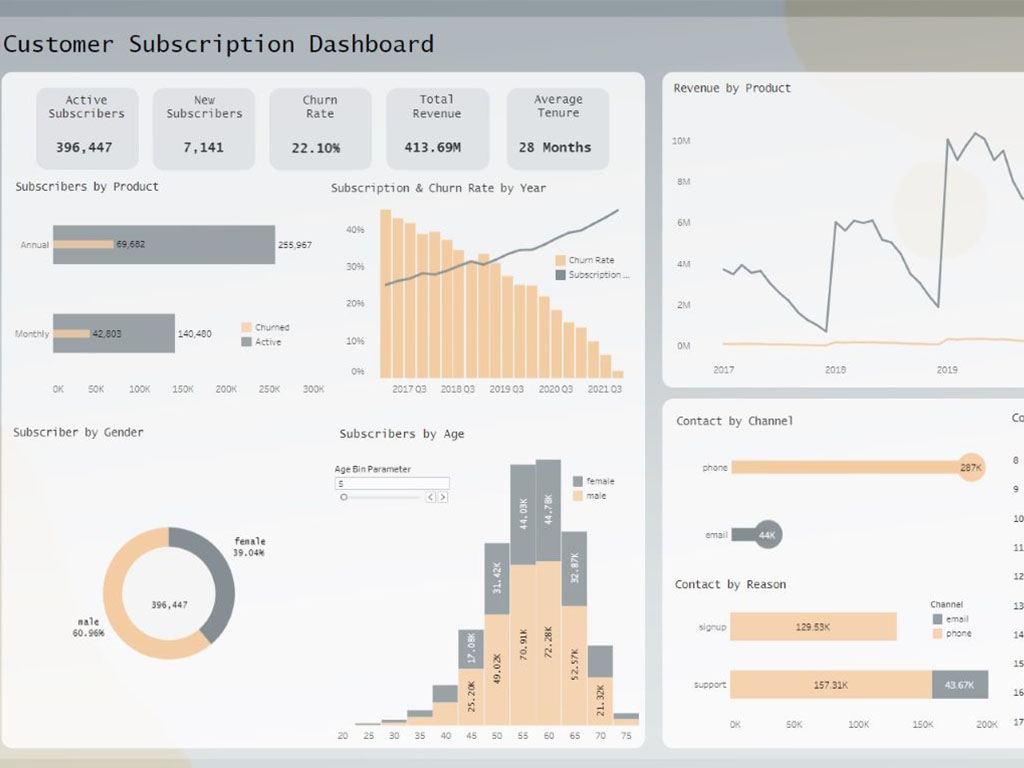
- Power BI


Tools
Software and tools I've utilized in my professional journey.


Skills
Essential skills I have developed and refined to excel in data analytics.
Data Cleaning and Preparation
Expertise in transforming raw data into a clean, structured format, ensuring accuracy and consistency for reliable analysis.
Data Analysis:
Skilled in examining data to uncover trends and insights, driving data-informed decisions through statistical and trend analysis.
Data Visualization
Proficient in creating clear, actionable visualizations that effectively communicate complex data insights to both technical and non-technical audiences.
Programming
Experienced in using programming languages like Python and R to manipulate, analyze, and automate data tasks efficiently.
Database Management
Competent in managing and querying databases with SQL, ensuring effective data retrieval and integrity for analysis.
Strategic Communication
Adept at translating complex data insights into clear recommendations and presenting them effectively to stakeholders for informed decision-making.
Certifications
Most significant certifications that highlight my expertise and demonstrate my continued improvement in data analysis include
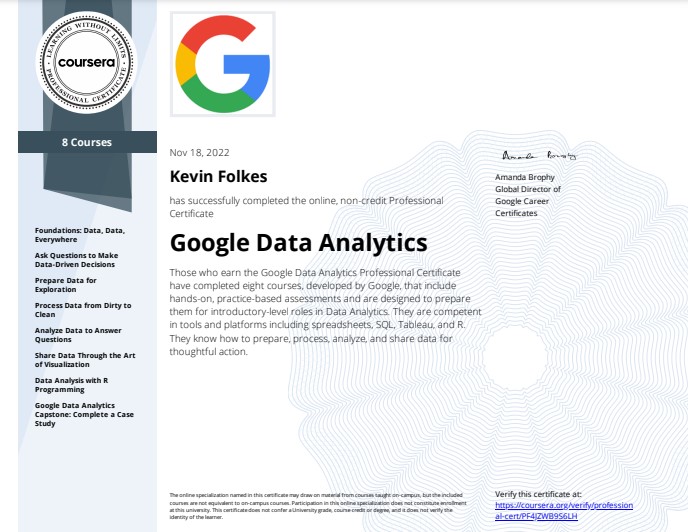
Google Data Analytics
The Google Data Analytics Certificate offers a robust introduction to data analysis, covering key areas such as data cleaning, statistical analysis, and visualization. It includes practical experience with tools like SQL and R, and emphasizes hands-on projects to apply learned skills to real-world scenarios. The program is designed to build a solid foundation for data-driven decision-making and problem-solving.
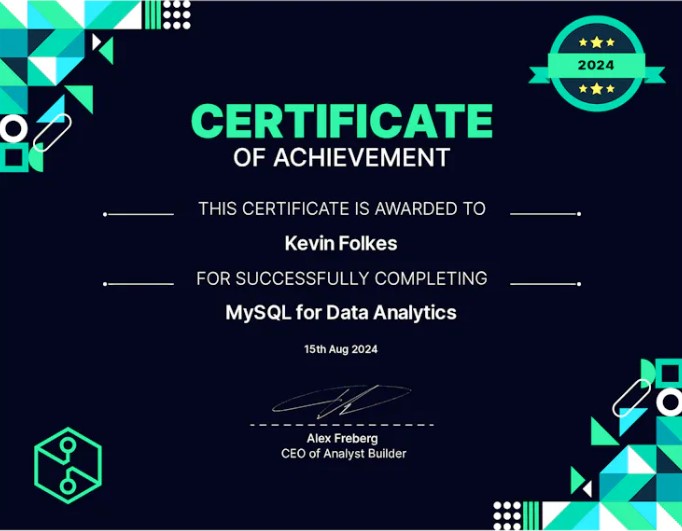
MySQL For Data Analytics
Analyst Builder
Practical SQL skills through a full MySQL course, including data cleaning, exploratory data analysis, and working within real-world MySQL environments. The course covered staging and production databases, naming conventions, and other essential concepts.
Python for Everybody
University of Michigan
Introduces programming with Python, covering fundamentals like data structures, web scraping, and database interaction. It focuses on practical skills and real-world applications, making it perfect for beginners seeking to build a solid Python foundation.
Tableau for Data Visualization
Analyst Builder
Develop a thorough understanding of Tableau, from the basics to advanced concepts. The course is structured with hands-on exercises and real-world applications, ensuring you grasp the intricacies of Tableau's visualization capabilities effectively. The highlight of this course is the interactive projects, where you'll tackle real-world data visualization challenges, refining your skills and building a robust portfolio along the way. By the end of this Tableau for Data Visualization course, you will be ready to showcase your Tableau proficiency on your resume and apply your newfound skills proficiently in various professional settings.
Python for Data Analysis & Visualization
Udemy
Teaches Python and key libraries for data analysis and visualization. It covers core Python3, data manipulation with NumPy and Pandas, and chart creation using Matplotlib, Seaborn, and Plotly Express. Utilizing Jupyter Notebooks, the course includes lectures, coding exercises, and real-world challenges, with lifetime access and downloadable resources for learners at all levels.